RampUp 2020: RampUp for Developers Recap – The New TV Landscape: Technical Challenges and Rewards
Speaker:
- Randall Kelley – VP, Research

Streaming, data, and other advancements in technology have transformed the relationship brands can have with audiences via TV, creating tremendous opportunities to improve how TV inventory is bought, sold, and measured. LiveRamp acquired Data Plus Math earlier this year to accelerate LiveRamp’s TV capabilities and offerings. In this session, attendees will learn how the technical and developmental challenges presented by the new TV landscape are solved by LiveRamp and Data Plus Math engineers, allowing advertisers to better connect with their audiences, networks, and TV programmers to offer them better intelligence. Lunch will be served in the room during this session.
You can watch the video below, and can read the transcript below that. You can also download the slides from the presentation (which also appear throughout the video) here.
https://player.vimeo.com/video/397315719
 |
|
| Randall Kelley: | First thing, I want to do is talk a little bit about who Data Plus Math is and what we do. So, the story goes like this. So, Data Plus Math was started about little over three years ago, and our mission statement was really to build next generation TV metrics and put them alongside digital. And what you’ll see as a theme in this talk is Data Plus Math was a very heavy user of LiveRamps identity graph. |
| Randall Kelley: | And you’ll see that identity is a key theme in this talk. Without it, you wouldn’t be able to do all of the cool things that we’re trying to do. We were acquired about, shoot, eight months ago now and so that’s been great for us. Before that, I was thinking about building my own graph, and now I don’t have to, I can leverage the one that LiveRamp built and it’s been great. So let’s move forward. |
 |
|
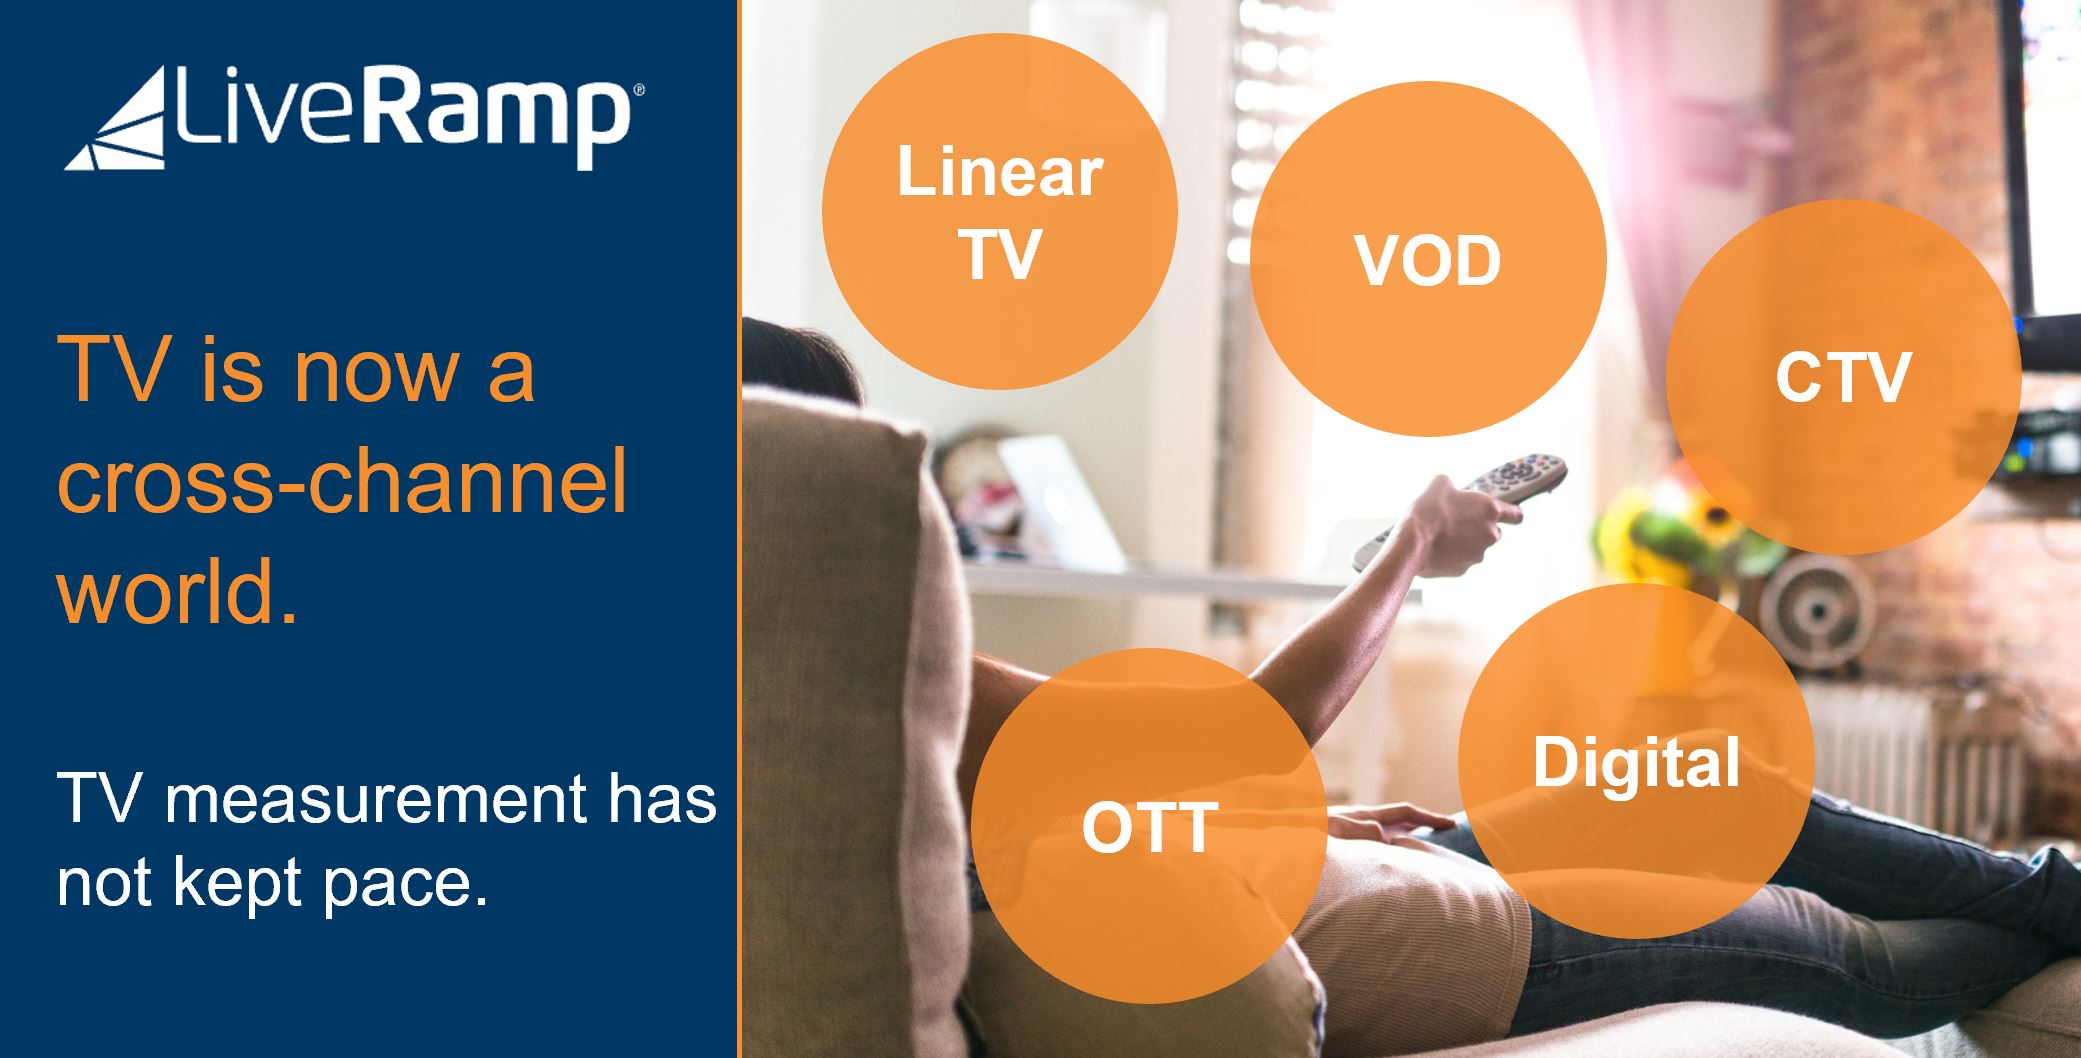
| Randall Kelley: | So, TV measurement’s been around a very long time, and what you’re going to see today is how we are trying to make TV measurements fast forward it to the rest of the ecosystem. So, for those of you that don’t have a TV background, let me just go through some of the acronyms first to level set everyone. So Linear TV, linear just means traditional TV. You watch it on your couch at home. It’s how I used to watch TV in college. |
| Randall Kelley: | If I wanted to watch Friends at eight o’clock I had to be in my dorm room watching the one TV that we all shared. And that’s how it was done up until the internet really changed everything. So, video on demand, VOD, you’ll recognize that, that’s I go into my set top box, I hit guide and I select, I want to watch Big Bang Theory and then episode three shows up and I can start watching. |
| Randall Kelley: | OTT, over-the-top television, oops, sorry. Back here over the top television. So these are… now you can watch things on your mobile phone, your mobile tablet. I’m a heavy watcher of who – my girlfriend got me into – How I Met Your Mother. So I’m catching up on 10 seasons. |
| Randall Kelley: | Connected TV. So smart TVs now, this is great. I just bought my first smart TV two years ago. I can just click an app and boom; Hulu shows up, and I can watch How I Met Your Mother either on my iPhone or on my connected TV. Also, older TVs you can plug in a Roku device and we have partnerships with Roku that allows us to stream video on your TV as well. |
| Randall Kelley: | And then of course digital, digital has been around 20 years. And so, really what the mission statement of Data Plus Math has been is to bring linear television and bring it up to speed with all of these other technologies and put them all together on a common footing so that we can build a complete view. |
 |
|
| Randall Kelley: | TV measurement challenges: So, traditionally, TV was built using a panel based approach. So you have a set of 75 to 100,000 households. They write in journals, those journals get submitted, they collate the data, you get your metrics. That’s obviously been updated a little bit, but still the basic approach is the same instead of a log, it’s now a digital device that catalogs people watching, but it just captures one component. |
| Randall Kelley: | And so you’re not going to see all the different screens. You’re only going to get one view into your campaign. And so the idea here is to try to capture all the different data sets and data sources and build the most accurate measurement you can for reach reporting. |
| Randall Kelley: | Fragmented data sets. If you measure linear TV separately from digital separately from your outcome data, you’re getting really an incomplete view. And so a lot of the aggregated models require looking for correlations and time and mixed modeling. And so, what we’re trying to do is build a person-level or household-level view into everything we’re doing. |
| Randall Kelley: | So the graph, and we’ll talk a lot about this, the graph enables this. TV lacks accountability that the digital world has, it’s way ahead of traditional TV on accountability. And so, the mission statement here is to bring television into the fold and bring them on equal footing with everything else. |
 |
|
| Randall Kelley: | Okay. So, identity is the key to all of this. And so you’ve heard a lot of great talks today about how the graph works, the underlying architecture, the online graph versus the offline graph. And all of that is super important. And what you’re going to see here is essentially a use case. It’s a study on how to take this graph and do something interesting with it. |
| Randall Kelley: | So in order to make this work, you need clear deterministic connections. What I mean by deterministic is it was an actual connection point with a piece of PII. So it’s not inferred, there was an actual connection. So you know for sure that this data point was linked to an individual or a household. |
| Randall Kelley: | The graph has two types of connections. So, I just mentioned deterministic. It also has the ability to do probabilistic connections. So, if you’re interested in scale, you can just dial the parameters a little bit differently and you can get a probabilistic match. But for the applications that I’m interested in, I really need one match per person. I need high fidelity matches. So it’s important that we don’t have any ambiguity as you bring the data in. |
| Randall Kelley: | Also the graph does a really nice job of curating the data for us. So it expires old email addresses, old cookies, all this stuff gets curated. So as a client of this, I don’t have to think, I can just use it and build my campaign. It looks like the T got clicked off here. Sorry about that. Okay, so the elements that you need to perform measurement – as I tried to break it down into the elements that you need. |
 |
|
| Randall Kelley: | So the first thing you need is a data. There it is. Okay. So, this little slide just shows it’s a nice pretty graph, but really there’s a lot of hard work that goes into bringing all this data in. So, in this case, you have TV data. It’s an obviously labeled TV. There’s a lot of different sources for TV. There’s sort of the Inscape Data, which uses ACR technology. ACR stands for Auto Content Recognition. |
| Randall Kelley: | This is the idea that they literally fingerprint images and match them up with content so that I know that someone was watching a Vizio TV and that they were watching The Voice at 8:32. That data gets collected and sent over to us; the video. So, I’ll talk a little bit about the tracking pixels in a little bit, but we deploy the tracking pixels, the Hulu ad gets served up, an http end-point call fires and we collect that data and then display ads. So all of this is necessary to build a complete view of everything as you’ve got to get data and you’ve got to get enough data that your models work. |
| Randall Kelley: | The next bit is identity matching. So again, it looks different over here than it does over here, anyway. So, what’s supposed to be in this circle is the LiveRamp graph. So, I’m not sure it must be a Microsoft thing. So, the idea is that, once you’ve got all this data – TV data, digital data – and also possibly outcome data, whether it’s first party data or website visits or whatever, you’ve got to bring them in into a common identity space. And that’s done using the LiveRamp graph. Yeah, it’s there. It’s just you can’t read it. |
| Randall Kelley: | Okay. Sorry. Third necessary component to all of this is this concept of a demographic spine. So, in this little two by two grid at the bottom here, what I like to think about these little green check marks is, so on the top you have the C stands for converted, “the household converted,” the C bar stands for “the household didn’t convert.” And on the vertical, you have the exposures, and whether the household was exposed or the household was not exposed. |
| Randall Kelley: | So when you bring this data in and you match it through the identity, you get 100% knowledge of whether the household was converted. So that’s the first two green check marks below the C. And then if the household is exposed, you get the green check marks on the horizontal for the E. But what you don’t necessarily know just by doing that by itself is the most critical piece of this is the “non-exposed, not converted” bin. |
| Randall Kelley: | And it turns out that most of our time is spent trying to get that bin right. This is where biases get introduced and it can totally throw off your model. So, the key to getting this right is building a demographic spine. There’s two components of this. The spine that is, what do I mean by a spine? I mean a set of households or a set of people that you have consistent measurement for the entire campaign measurement period. |
| Randall Kelley: | So, you’re consistently reporting on these households and so you know that if they don’t see an ad that it’s not because you just mismeasured on this because they didn’t see the ad. The demographic component of this is you need to have information about these households. You need to know if you’re trying to do targeted measurement, you might want to know if they own a Ford truck or what their household income level is, how many kids did they have, et cetera. So all of that is a necessary component to get all of this to work. |
| Randall Kelley: | Lastly, you need the methodology. So, I’ll talk a little bit more about this at the end. But once you’ve done all this hard work to get the data, matched it through the identity graph to your demographic spine, made sure you controlled biases, you can now finally apply your statistical modeling. |
 |
|
| Randall Kelley: | Okay. And again, the getting all this to work is, it’s all powered by the device graph. So it really won’t work if you don’t have this core piece of technology, which we’ve heard a lot about today. You’ve heard a lot about it, but just to say it again, for those of you that weren’t in the earlier talks, the graph brings in lots and lots of datasets. Digital cookies, mobile IP… sorry, mobile IDs for your phone and tablets, connected TV IDs, TV subscriber IDs from a set top box data and ACR partners and then IP addresses. |
| Randall Kelley: | Also, we just – two talks ago – we heard a lot about privacy and that’s really key to getting this to work. So the raw data gets sent into the gear here, which represents the LiveRamp APIs and the personal information is replaced with a hashed identifier. It’s called an IDL, IDLink, and all your data sets have to go through this process. So you send your ad events on one side, you send your sales data on the other side, you replace all of the personal information with the correct hash and that allows you to join the data sets together. And again, I don’t want to belabor this, we just saw a whole talk in this, but it’s all done in a way that respects privacy and all of the laws there. |
 |
|
| Randall Kelley: | So let’s go through the complex… how this thing can get pretty complex. So a typical ad campaign might look like this. Let’s start on the right. On the right, we’ve got four different types of events. So, starting from the top. Let me back up. So, you might be interested in measuring a campaign for a fictitious “homeproducts.com” let’s just give it a name. So you have this company called homeproducts.com and you’re attempting to measure their ad campaign. |
| Randall Kelley: | And so each of these four dots represents four different types of conversion events. Sorry, the top two dots represent exposure events and the bottom two circles represent conversion events. So you start with, there’s TV. It’s hard to read so I’ll just go through them. On the top is the event represents a TV ad exposure. |
| Randall Kelley: | The next represents a digital ad exposure. That could be a video ad or a banner ad. Then we have a conversion event. You might be interested in measuring website visits to homeproducts.com, and then maybe there’s brick and mortar stores. You might be interested in mobile location events to homeproducts.com. |
| Randall Kelley: | On the left is a picture of the device graph. And this is a picture of my house. So, one of these, you can see my name Randy with the individual IDL. I live in a house with my partner Haley, and she has an Android phone. I have an iPhone and we don’t fight about that. Actually that’s not true. She makes fun of me all the time because my phone is three times as expensive as hers. And then of course, we have a connected TV that we watch Hulu one and cable. I have to watch the Premier League. |
 |
|
| Randall Kelley: | So, this is the setup and so, the key here is how do we get this data connected in the right way? There it is. Okay. The first data set I want to talk about is the ACR data. Through the subscriber ID we send that into the LiveRamp graph and what that does is it maps it to a connected TV… Sorry, the connected TV is mapped to me, so I have a direct connection to me through the LiveRamp graph. Okay. |
 |
|
| Randall Kelley: | The digital event is the most complicated one. So here, the conversion web event is a track through the DPM pixel. We have a tracking pixel that gets deployed on the website and it’s a piece of JavaScript that runs and pulls cooking information out of the browser and serves it up through an HTTP call. And there’s a bunch of stuff. I’ve only showed a few things here that are inside of that pixel. |
 |
|
| Randall Kelley: | There’s a first-party cookie if it’s the homeproducts.com cookie, Data Plus Math drops a cookie on there, which sometimes can get blocked. I’ll talk about that in a minute. IP address information, there’s a bunch of other things. The type of browser through the user agent; there’s all kinds of information embedded in this pixel. |
 |
|
| Randall Kelley: | But the key here is how do we get that mapped to an individual? Well, the graph allows you to grab these cookies and go through to the phone and ultimately to me, and this is important because if you can’t make that connection to me, then you’re not going to be able to measure the ad campaign here. |
| Randall Kelley: | Now notice I drew an arrow to the IP address and I want to talk about that a lot because in a world where third party cookies are becoming troublesome, we need to find other solutions. So, LiveRamp has a new product: the CT connected TV IP graph, which allows… the data science team has done a really nice job of building what they think have strong connections between connected TVs and IP addresses. IP addresses are very ephemeral. So this is really tricky stuff. But we’ve had very good success with it so far. |
 |
|
| Randall Kelley: | And so you now have multiple paths to get from that digital event to the household. You can go through the IP to the connected TV or you can go through the device. What I didn’t show here is the digital ad can also go through cookies if you have them, but we typically go through the IP address. |
| Randall Kelley: | Mobile location data. We have several mobile location providers… vendors that we use. So the idea here is that they track the mobile ID and these store visits. So we get a feed where I know that this iPhone went to the homeproducts.com brick and mortar store, through the graph, I can get that device mapped to me. Some of our providers also provide a IP address. And what this is, is not just any IP address because obviously phones connect to a lot of IP addresses. What they do is they give you what they think is the best home IP address. |
| Randall Kelley: | So, they keep track of all the mobile location data and they have an algorithm data they run where they say, "Look, this phone has been inactive dormant for 12 hours, overnight." And so they infer that, that’s likely the home IP address. So that’s another way that we can get the data mapped to the household. Oops, sorry. Clicked too quickly here. There we go. |
| Randall Kelley: | And then the last piece is if you want to do audience measurement, you need the attributes. And so, I just threw this here as an afterthought, but this is actually a very important component here to make sure that I actually have demographic information. It makes your models better, but you can also just do straight forward measurement there as well. |
 |
|
| Randall Kelley: | Okay. I just went through a pictorial representation of how to put one of these campaigns together. So, I’m going to show you two again, in a more data way. Let’s see, one more click. So, what we have here is a bunch of different datasets. We’ve got ad server exposures, transaction data, customer relation model data, TV viewership, site visit data. And each of these has a different ID space. |
| Randall Kelley: | So you notice on the ad server, I have device IDs, I’ve got customer IDs, I’ve got email addresses. There’s no way to link this together unless you have an identity graph. All of these get sent through the LiveRamp APIs and the PII is replaced. Hopefully, this clicks through. There it goes. |
| Randall Kelley: | Okay. So once it goes through connect select. The same data, comes back but the integrity is preserved, and I’ve replaced all of the personal information with these identity links. Once they’re in this anonymized ID space, I can now link all that data together and build a complete view of that household or individual. So now I know that it didn’t leak XY 101 ABC has all of these attributes, and now I can start doing my modeling. So, this is a different way to see the same thing. I was showing it to you graphically and now I’m showing it to you the mechanics of how you actually perform these links. |
| Randall Kelley: | I did mention IPs and we’re heavy users of IPs and I just wanted to share a couple of things that can go wrong if you do this poorly. So, I put a little cartoon picture up here just to illustrate what can happen if you’re not careful. So here, you have a page view to say homeproducts.com and it went through a specific IP address. And my connected TV is reporting on that same IP address. |
 |
|
| Randall Kelley: | Now I didn’t know this until I started digging into the data, but people can connect their TVs through their phone or a hotspot. And so, one of the things that can happen is you have these IP addresses or mobile IP addresses so that there are several hundred or even thousands of TVs reporting on the same IP address. So in this case I drew two but replaced two with a thousand. |
| Randall Kelley: | And so you have a bunch of random TVs that are also reporting that same IP address. So now this one conversion event now looks like it got mapped to a 100 households. So what can happen is it can give really high conversion probability. So, this graph I showed you here is actual data where you just did the naive thing, you didn’t do any curation and you just blindly joined an IPs and it can blow up. |
| Randall Kelley: | So what you’re seeing here is at frequency, say 60 or 80, what this plot is showing you is that you have 80% conversion probability, which is absurd. So down there on the bottom, TV has a much more respectable 10% conversion probability. So, this is just some things that we’ve learned and why – and another way to illustrate why having a curated identity graph is so important. |
| Randall Kelley: | There’s a couple of other pathologies that I mentioned here as well. The same thing can happen if the IP addresses are hidden behind a translation, a NAT, a network address translation layer. There can also be servers that convert the IP version six into IPv4s. So all of this stuff can make everything more complicated. Just to conclude, high fidelity matching is critical to getting all of this to work. |
| Randall Kelley: | Okay. So, after you’ve done all this hard work to get your data whipped into shape; you’ve done the ID matching, you’ve built your spine, you can actually start doing the modeling. And so, this is a cartoon model. I’ve had a 100 people ask me, "Do you really use a product of…?" No it’s not. This is a cartoon. |
 |
|
| Randall Kelley: | And so this mathematical formula here is supposed to represent the conversion probability. So we do actually compute conversion probabilities for each household. It’s a function of time and it’s a function of different types of attributes. And so, this representation is trying to partition those attributes into three broad categories. |
| Randall Kelley: | Category number one is attribute based. So, they come in two flavors. There’s what we like to think of is behavioral based attributes, viewing patterns. How much TV did you watch, how much HDTV, do you watch Property Brothers, et cetera, or more static, slowly changing attributes like first party or third party attributes, what’s your household income, how many kids, do you own a Ford truck, et cetera. |
| Randall Kelley: | The second class of features are sort of agnostic of the individual and really more high level. Was it Christmas that can throw off your conversion rates, is spring versus summer depending on what your product is. And our models take into account these things and correct for them. |
| Randall Kelley: | And then finally the most important one is the ad exposure. So, once you’ve built this feature matrix where you’ve captured all the touch points for individual households, you can actually build models to try to measure the effect. So, in this slide, again just to summarize, attribute based features, external factor based features and then add exposure based features. |
| Randall Kelley: | The model is trained at the individual or household level. You then once the model is trained, you can then do all kinds of what if scenarios and aggregations, what is the effect of my specific channel or property? And then the way this works is you turn on and off the ad exposures and see what the difference in the probability is and you aggregate that difference up and that gives you a measure of how effective that particular channel was. And that’s it. So I’m five minutes early and welcome to take questions. Yeah. What’s up? |
 |
|
| Audience Questions: | When you analyze different data sources coming together in the graph and match them to one unique identifier, what’s the most commonly used unique identifier that LiveRamp uses to make those connections? |
| Randall Kelley: | You mean internally? |
| Audience Questions: | Yeah. |
| Randall Kelley: | Well, they have two separate products. There’s the online graph and the offline graph. The online graph is mostly cookie-based, mobile ID based, and the offline graph is built up over quite I think there’s 40 years of external data sources feeding into it, email, mailing addresses, et cetera. So I don’t have a clean answer for you, but it really depends on what you’re trying to do. |
| Audience Questions: | But mostly for online cookie identifiers, maybe? |
| Randall Kelley: | So, I think depends on which part of the graph you’re talking about. Certainly, for the connected TV IP graph, there’s a lot of various touch points that go into that. So what they do is they say, let me take an IP and let me look and find all of the IDLs that report on this. And then they curate it down to a smaller set of IPs. So there’s a lot of nuance and go into it. |
| Randall Kelley: | I believe email addresses play a big role there. As far as the internals of the online and offline graph, I’ve been more of a client of it rather than in there myself. Any other questions? Yeah. |
| Audience Questions: | You alluded to the panel based measurement system that used to exist for TV and there’s been an enormous amount of progress there in the last few years with what you’re doing. Old Linear TV was a single standard that everybody just agreed to do it a certain way, but now so there’s so many ways to do it. Does the industry need a new way to standardize, and how does that happen? |
| Randall Kelley: | Yeah, well I think it comes down to trust. Yeah. That’s one of the mission statements of Data Plus Math and part of the strategic partnership with LiveRamp and why they acquired us is really about trying to establish a new currency. There’s a lot of people trying to do it. We’re trying to do it better than everyone else. We think the graph gives us a leg up on that, but it really comes down to establishing a very rigorous, repeatable methodology that everybody can get behind and trust. And so we’re working very hard to get there. Yeah. |
| Audience Questions: | What’s your take on the home viewing; the number of people watching one tv at a time? |
| Randall Kelley: | So you’re asking a question about when I’m in a household and I have four people watching a TV versus… Yeah. So most of our campaigns, and let’s say, almost all of them are based on the household. So you hear people talk about people-based, we actually do a household based measurement. So the idea that we actually see a strong signal when we do that. |
| Randall Kelley: | In the example that I gave earlier, you might get a connection to Haley, because the Hulu account is in her name. So, I might see a Peloton ad, but it came through her device, right? So all of that, if you do things at the household level, that just goes away because you’re really looking at the whole thing is a unit rather than individuals. |
| Audience Questions: | So what is your general plan to move forward with something like that? |
| Randall Kelley: | Yeah, that’s on our roadmap. Certainly, that’s more challenging for reasons that are obvious, but with the individual IDL, so we do a lot things with the household IDL, but with the individual IDL, you can certainly get there. We’re going to have to solve the combinatorics problems that you just alluded to. Any other questions? All right. Thanks. |
Interested in more content from RampUp?
Clicking on the links below (to be posted and updated on an ongoing basis) will take you to the individual posts for each of the sessions where you can watch videos, read the full transcript of each session, as well as download the slides presented.
- RampUp 2020: RampUp for Developers Recap
- Migration to Google Cloud Platform (GCP): Overview, Benefits, and Lessons Learned
- The Architecture and Future Direction of the LiveRamp Platform
- The Mechanics Systems behind Lookalike Modeling
- How LiveRamp Addresses GDPR, CCPA, and Future Data Regulations
- Enabling Programmatic Integrations and Flexibility through APIs
- The New TV Landscape: Technical Challenges and Rewards
RampUp for Developers’ inaugural run was a great success and was well attended by a variety of attendees. Many interactions and open discussions were spurred from the conference tracks and discussions, and we are looking forward to making a greater impact with engineers and developers at future events, including during our RampUp on the Road series (which take place throughout the year virtually and at a variety of locations), as well during next year’s RampUp 2021 in San Francisco. If you are interested in more information or would like to get involved as a sponsor or speaker at a future event, please reach out to Randall Grilli, Tech Evangelist at LiveRamp, by email: [email protected].